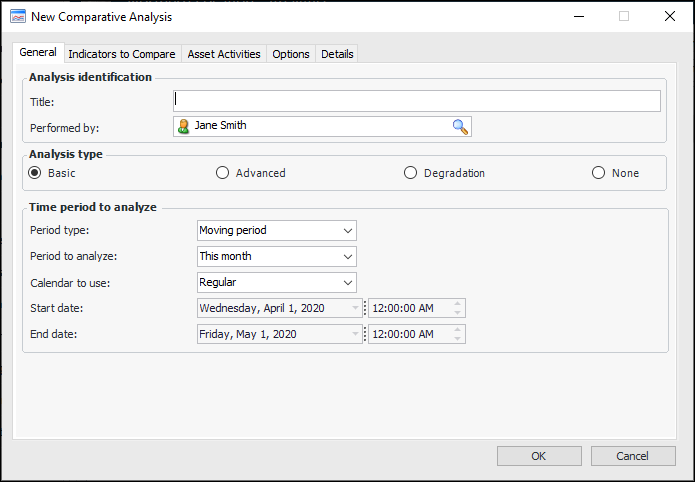
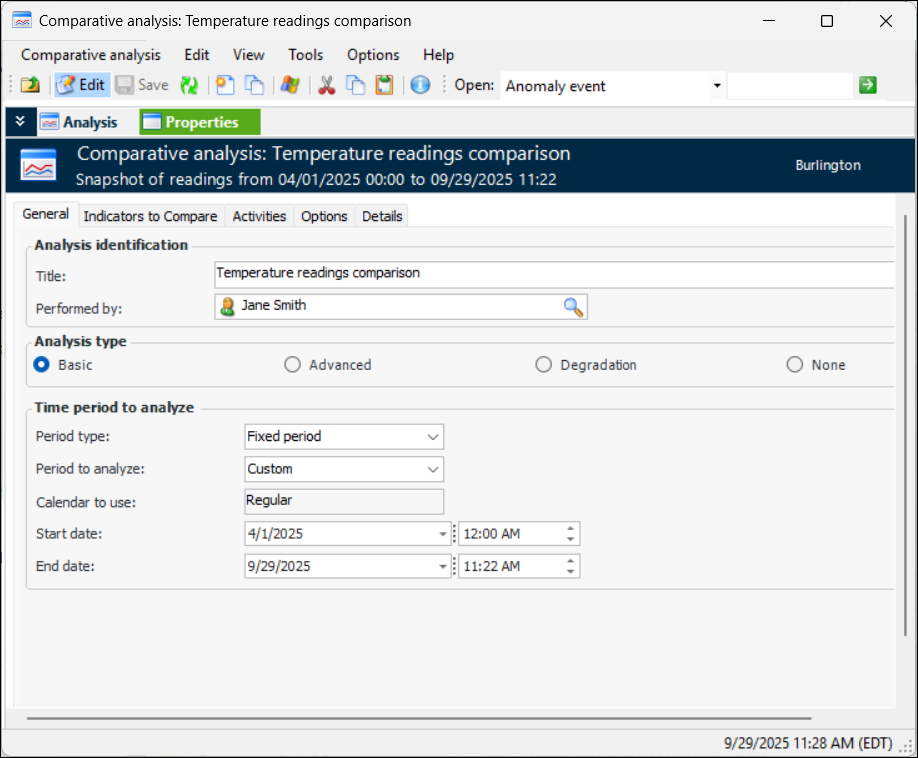
Creating a Basic Comparative Analysis

When creating a comparative analysis, you can choose one of four analysis types: basic, advanced, degradation, or none.
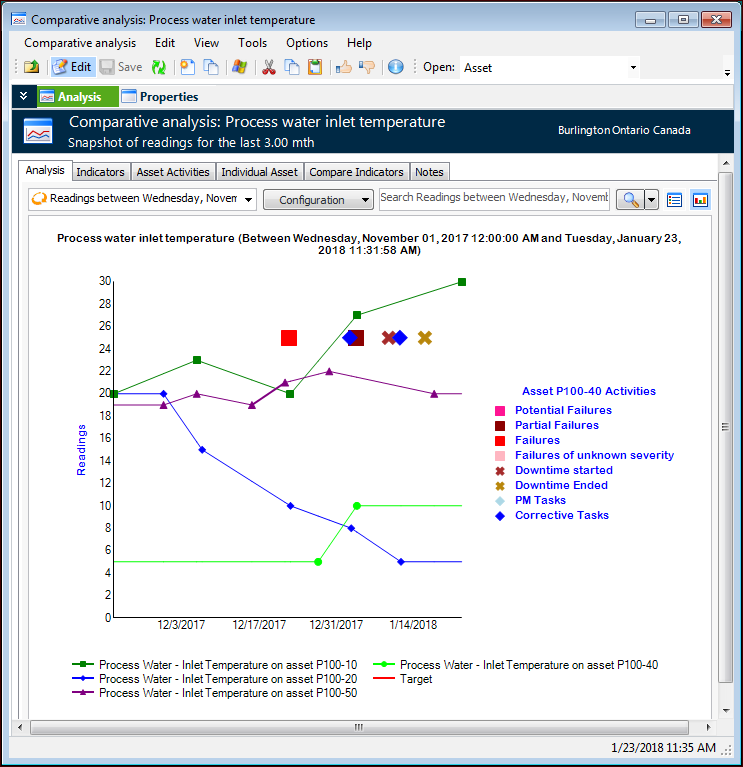
Note: If you select None as the analysis type, the Analysis view does not display the Analysis tab and graph. Readings for the time period, current values, and activities are shown in tables.
This topic explains how to create a basic comparative analysis. The following table shows the basic and advanced analysis types, their features and options:
For related information, see:

To Create a Basic Comparative Analysis

1.
In the Site or Asset window, select the Analytics view and the Comparative Analyses tab. This tab shows all existing analyses for the site or asset.
2.
Click New. The New Comparative Analysis dialog appears.
3.
4.
On the General tab, select the time period to analyze.
5.
Moving period: Select this option to set a time period that is relative to the current date. For example, if you are setting a time period for a comparative analysis, you could create an analysis for readings collected in the last month. If you select this option, each time you open the analysis or dashboard, you might see a different set of readings depending on the current date and the period that was selected to analyze.
Fixed period: Select this option for a set time period. When you select this option, you can define the start and end date and time.
Regular: the readings displayed are filtered based on the standard calendar. For example, if the dashboard is showing readings for the current month and the date is December 10, the dashboard shows readings for the period of December 1-10.
Financial: the readings displayed are filtered based on your organization’s financial periods. For example, assume that your financial periods start on the first Tuesday of the month. For December 2002, the financial month would then start on December 3, 2002. In this case, on December 10, 2002 a dashboard that is showing “current month” based on the financial calendar would show readings for the period of December 3-10.
6.
On the Indicators to Compare tab, click Browse. The Browse Indicators dialog appears.
7.
Select the indicators for the analysis and click OK. They are listed on the Indicators to Compare tab.
8.
Select the Options tab, for example:
9.
Select this option to show the Analysis view, Analysis tab. This tab displays readings over the specified time period.
Select this option to show current indicator values in the Analysis view, Indicators tab, Current tab.
To replace the default chart style shown in the Analysis view, Analysis tab, select a chart type from the list.
Note: This option is available with the basic analysis type when the Show readings history option is selected.
To replace the default chart style shown in the Analysis view, Indicators tab, Current tab when the Chart icon is selected, choose a chart type from the list.
By default, a gauge sidebar is displayed in the Analysis view, Indicators tab, Readings tab. You can turn this feature off by clearing the selection.
By default, the target line is displayed in the Analysis view, Analysis tab. You can turn this feature off by clearing the selection.
10.
Select the Activities tab.
11.
12.
To create the analysis, click OK. The Comparative Analysis window appears. Select the Properties view, General tab to review settings. For example:
13.
Select the Analysis view to see charts of the comparative analysis, For example:
14.
Select the Analysis view, Indicators tab to view readings and current values for the analysis (Current values on the Properties view, Options tab must be selected).
15.
Select the Asset Activities tab to view tables of the asset’s activities. You can choose from these table configurations:
16.
Select the Individual Asset tab if you wish to view the indicator comparison chart for one of the analysis assets. Select an asset. For example:
Note: Only numeric indicators are supported on this chart.
17.
Select the Compare Indicators tab if you wish to compare a subset of the indicators on the analysis. Select the indicators in the table on the left, click Save, and then click 
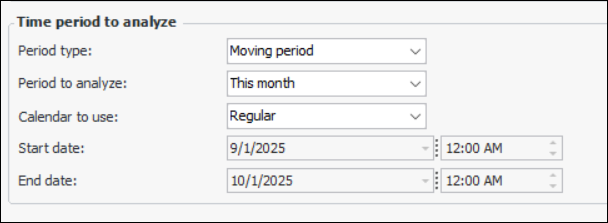
to refresh the chart. For example:
Note: Only numeric indicators are supported by this feature.
18.
Select the Notes tab to record information about the analysis.