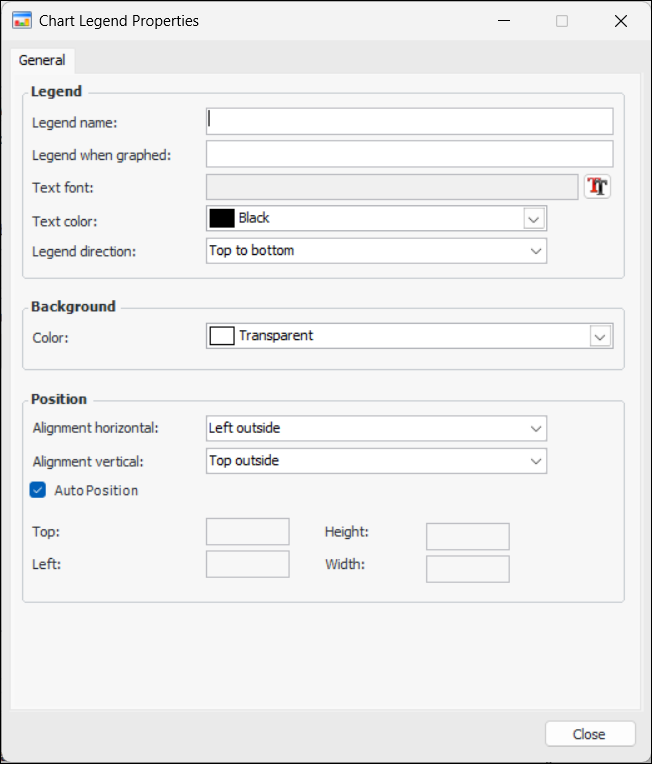
Creating a Legend for a Chart

A customized legend can be defined and included with any APM chart. You can determine the font colors, sizes, and location of the legend.
All legends that have been defined for a chart can be viewed on its Configuration Dialog, Appearance tab, Chart tab, Legend tab.
This topic describes how to create a legend for a chart.

To Create a Legend for a Chart

1.
2.
On the Appearance tab, View as area, ensure that Chart is selected. In the Chart tab, select the Legend tab.
3.
Click New. The Chart Legend Properties dialog appears. For example:
4.
5.
6.
7.
8.
9.
In the Position area, either:
Select Auto Position and then the horizontal and vertical alignment
or
Clear Auto Position and then enter your own pixel positions for the top, left, height, and width of the legend
10.
When you are finished, click Close. The legend is added to the tab.