|
|


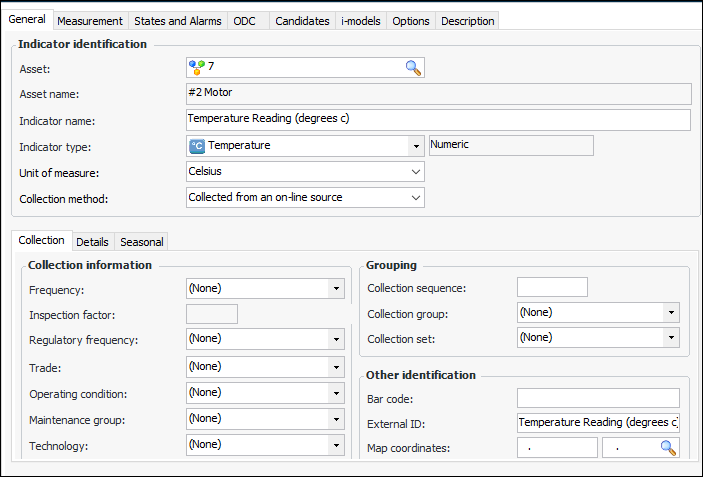
Configuring Indicators to Collect Online Data
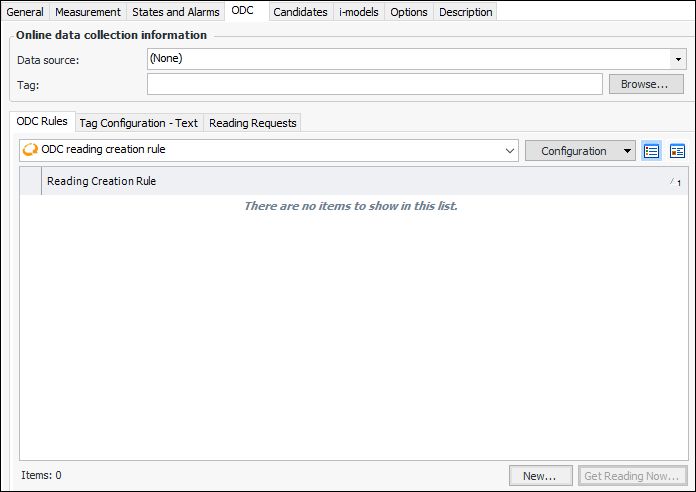
Configuring an ODC indicator involves selecting the data source, connecting to the data source, and selecting the data tag. After you set the tag for the indicator, you will also need to define the reading creation rules. See Configuring ODC Reading Creation Rules.To Configure an Indicator to Collect Online Data
OPC HDA Example
Note: The smaller the Max Values setting, the less time it will take to create and process indicator readings. We recommend setting Max Values to between 10 and 50.Tip: For HDA servers that allow filtering, you can select Enable tag browse filtering on the Select OPC HDA Server dialog, and the filter box and search icon will be displayed on the OPC HDA: Browse for Tag dialog. For example:OPC DA Example
The search area of the OPC DA: Browse for Tag dialog expands to display branches and their items when Enable low level browsing is selected:Tip: You can use wild card characters in the Item Filter box, such as using an asterisk (*) to represent any number of characters, or a question mark (?) to represent a single character. Doing so will filter the branches and items that match your filter criteria; filters are not case-sensitive.PI Example
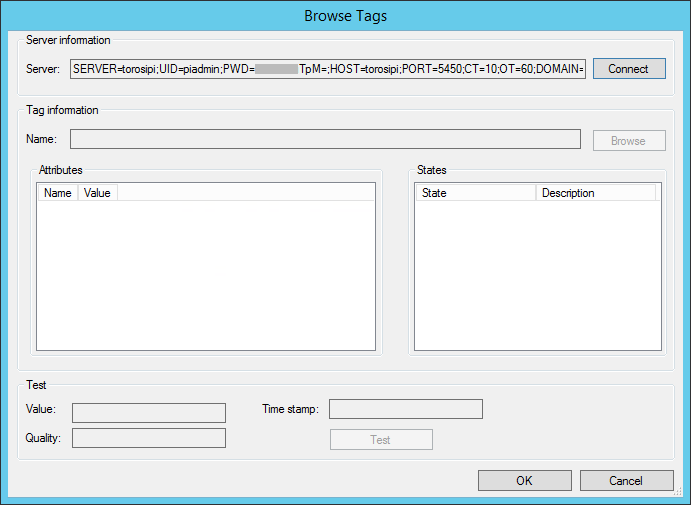
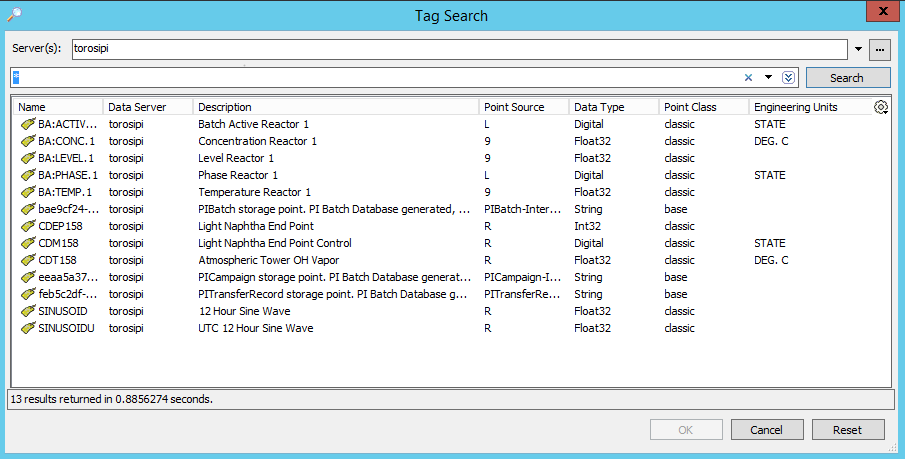
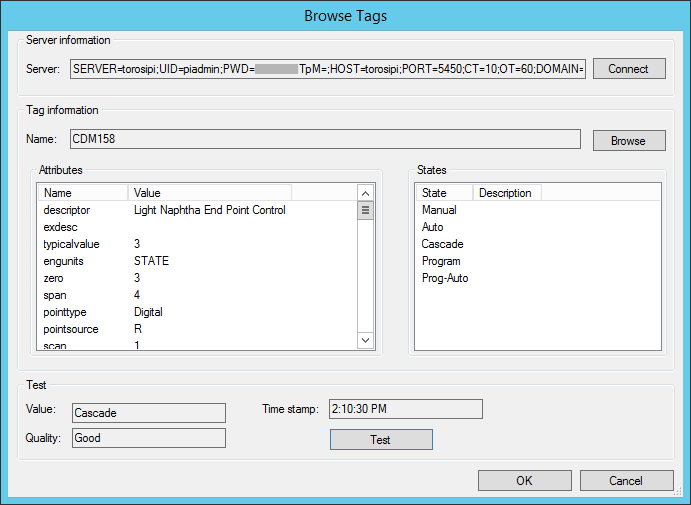
Click Connect to connect to the server.Click Browse to open the Tag Search dialog, where you can search for tags and select one with the appropriate data types for the indicator.When you click OK, the Browse Tags dialog is populated with the tag information. Click Test to view information about the tag. If you are creating a descriptive indicator and its states have ODC mappings, the States area is populated. For example:PI AF Example
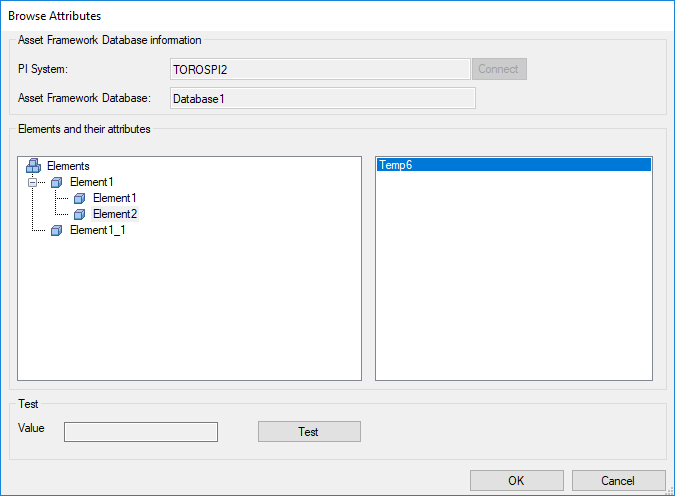
Click Connect to connect to the PI system.Click Test to view information about the tag.
 is enabled.