|
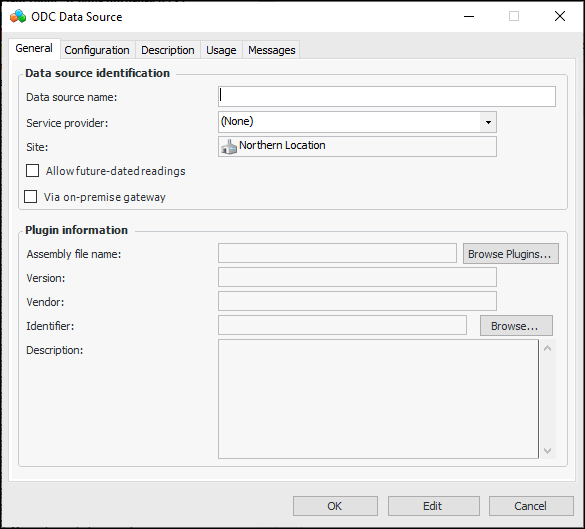
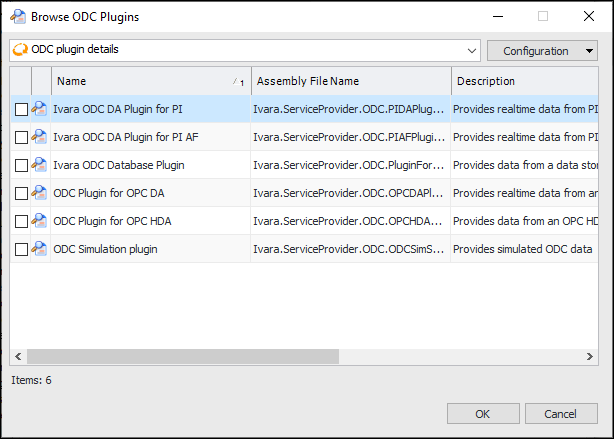
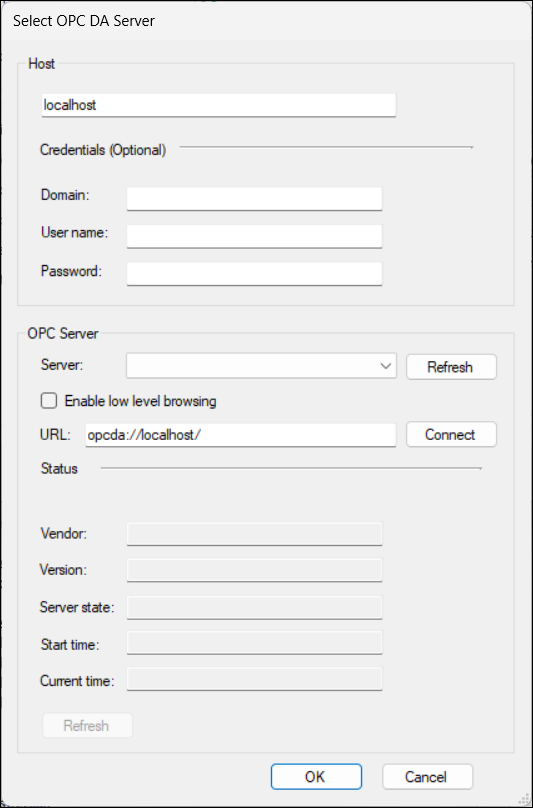
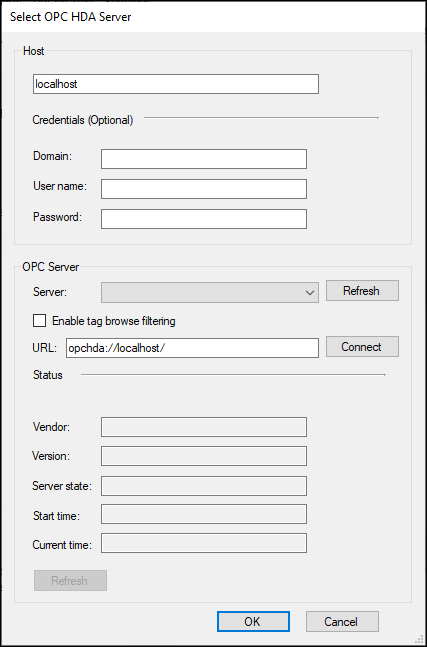
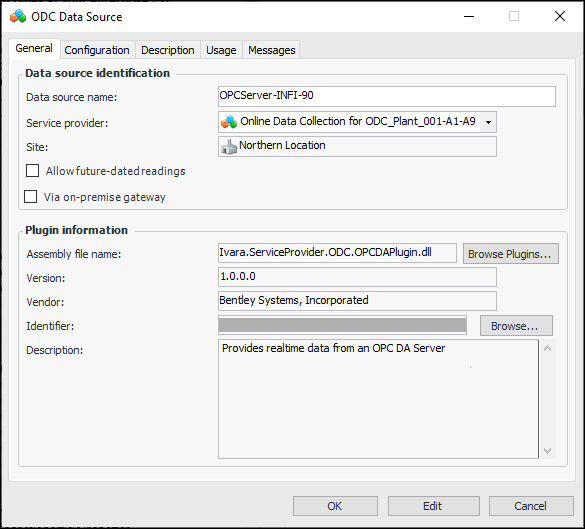
Configuring Data Sources for OPC Plugins
To Configure a Data Source for an OPC Plugin
1. From the Site window, select the Inspection Management view and the Settings tab. Select the Indicators tab and the Indicator Settings node in the tree.Tip: You can also click the Administration menu, Inspection Management Settings, and then Indicator Management. The Indicator Settings window appears.
2. Note: You can also create a data source that is available to all sites that use the Online Data Collection module. On the Enterprise window, select the Services view, ODC tab, and then the Data Sources tab.
3.
6. Click Browse Plugins. The Browse ODC Plugins dialog appears.
8.
9. To permit future-dated indicator readings, click Allow future-dated readings. If the server clocks are not perfectly synchronized, the ODC service is still able to return the most recent indicator readings.
10. If you are using the APM on-premises ODC agent to manage data collection, select Via on-premise gateway.
11. Click Browse to select the target ODC server. The following example dialog is for the OPC DA plugin:Note: If the Select OPC DA Server dialog does not appear, log off and log on again, and repeat this step.Note: If you are using the on-premises agent, the hostname and server URL are provided by the agent.Note: If you are using the on-premises agent, the hostname and server URL are provided by the agent.
12. Enter the hostname in the Host box.
13. In the OPC Server area, select a server from the list, then you can click Connect and then review the state of the server in the Status area.
14. For DA servers, select Enable low level browsing to allow low level searches when you browse for tags.
15. For HDA servers, select Enable tag browse filtering to display the filter box and search icon for HDA servers that allow filtering of tags. If your server does not allow filtering, do not select this option and it will not be visible when browsing tags.
16. Click OK to return to the ODC Data Source dialog. The General tab displays information about the plugin and connection. For example:The Identifier value (obscured in the example above) is encrypted and displayed as hashed for security reasons.
17. Select the Configuration tab to enter additional information about the configuration of the data source.
18. Select the Description tab to enter additional information about the data source.Tip: After you have configured indicators and started collecting online data, you can return to the ODC Data Source dialog to see information about how the data source is used. Select the Usage tab to see which indicators use the data source. Select the Messages tab to view ODC message logs.
19. Click OK to save the data source and close the dialog.