|
|


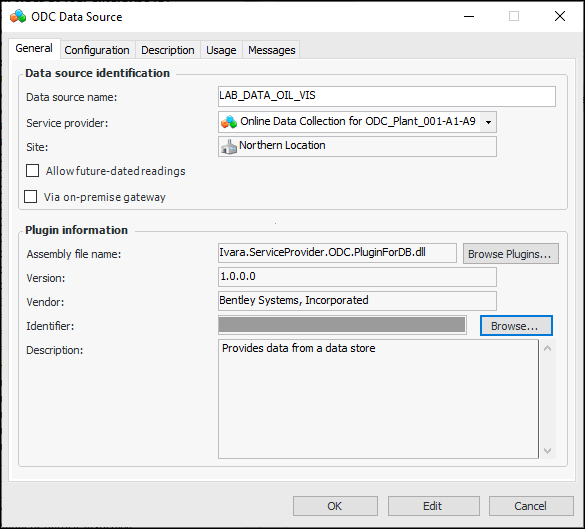
Configuring Data Sources for the DB Plugin
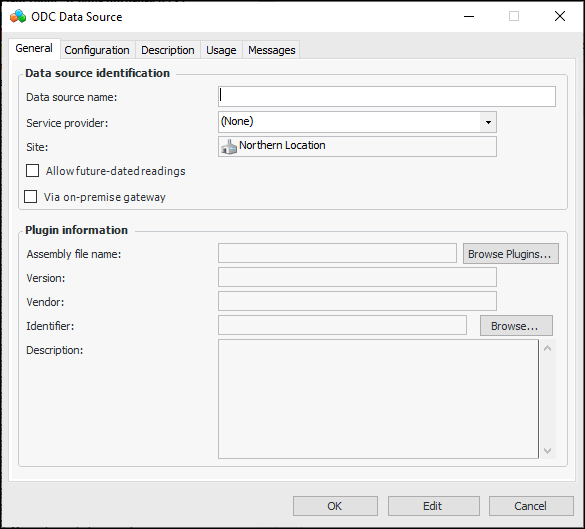
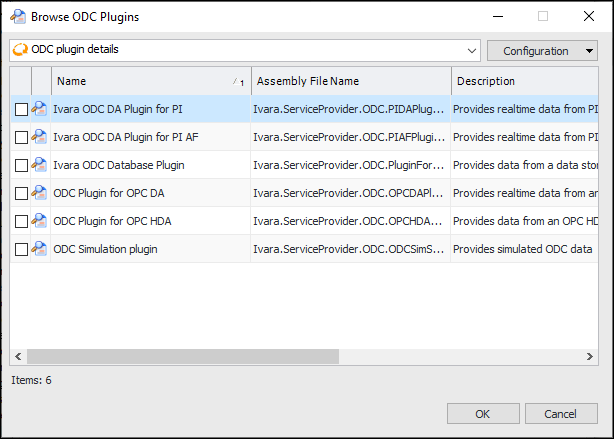
To Create a Data Source for the DB Plugin
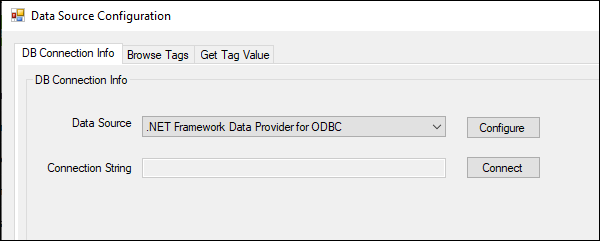
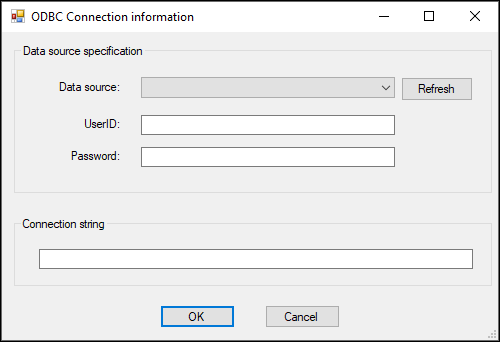
To Configure Connection Information for ODBC
Browsing for Data Tags and Getting Tag Values
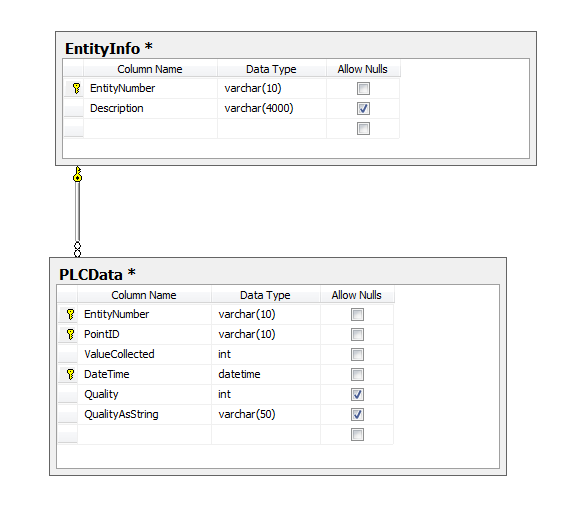
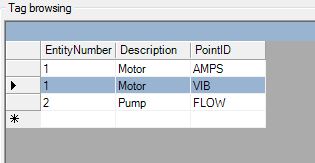
Example Database
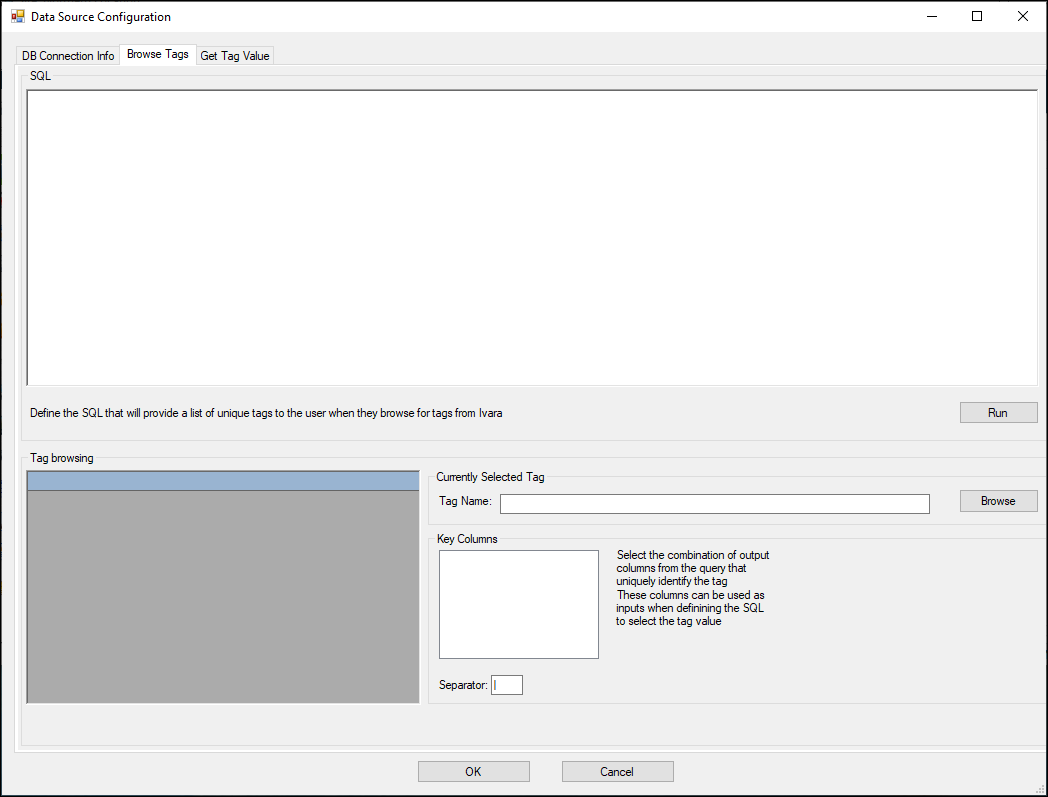
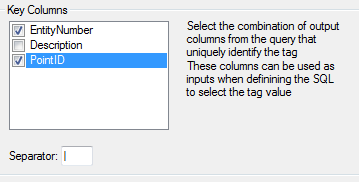
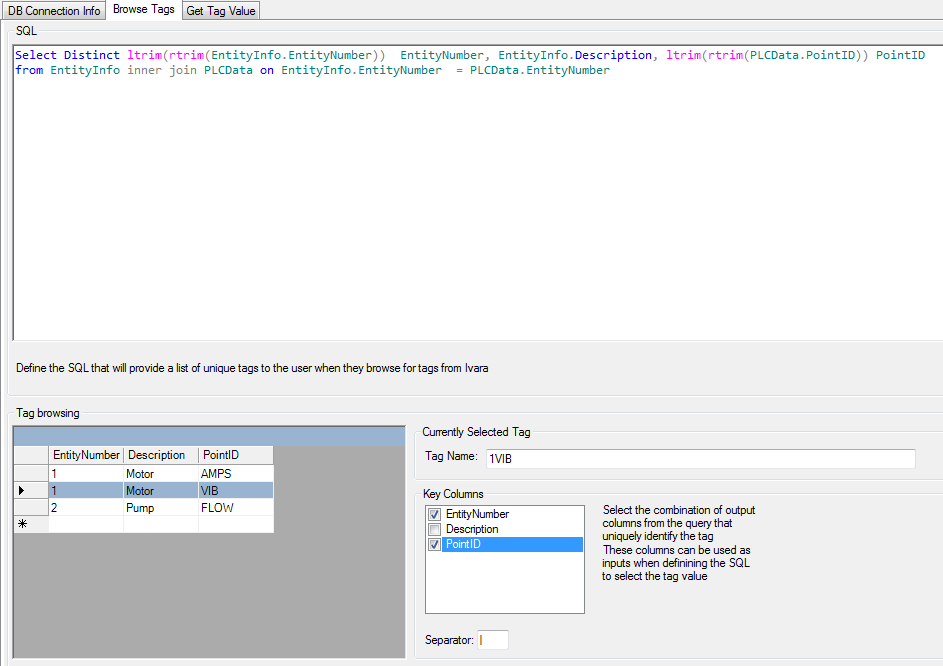
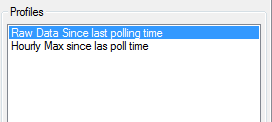
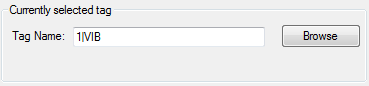
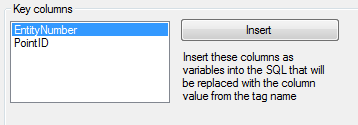
To Browse for Data Tags
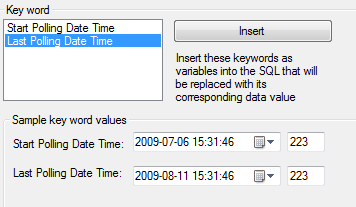
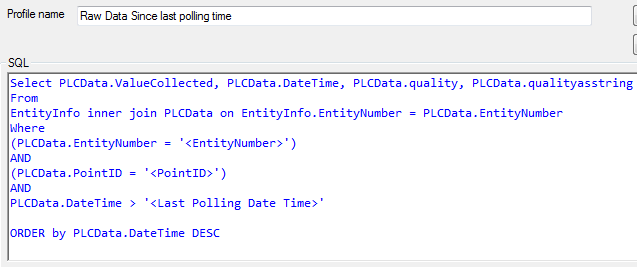
If you have not already done so, connect to the data source before selecting the Browse Tags tab. On this tab, you can enter the SQL statement that will provide a list of tags to get data from.
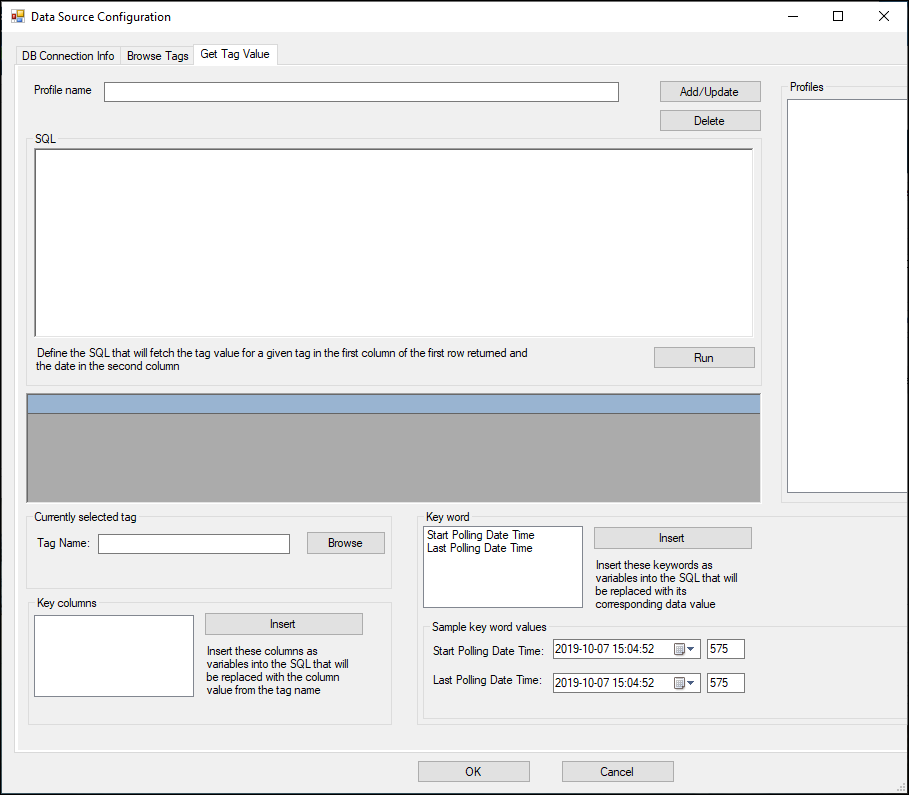
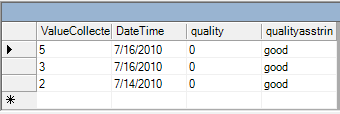
To Get Tag Values