|
|


Creating a Cumulative Indicator
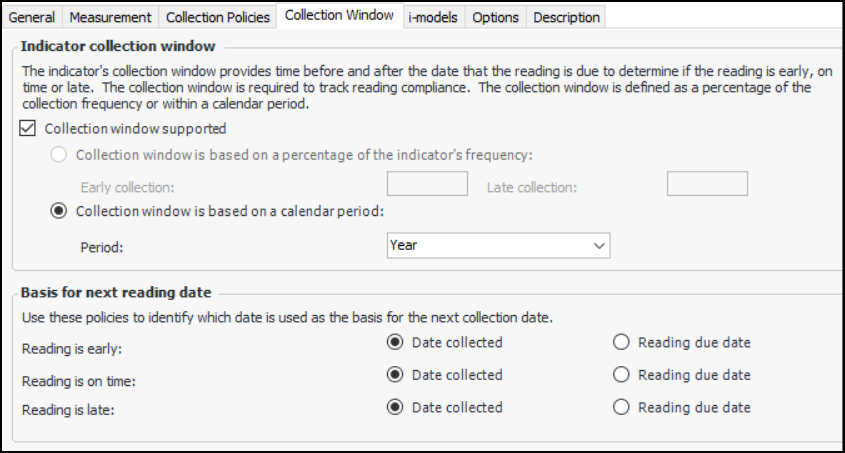
Using the indicator’s collection policies, you can specify how its reading due dates are calculated. You can also set up the indicator’s collection window to define early and late collection periods. You can track collection compliance using table configurations, sidebar dashboards, and KPIs. For information about viewing an indicator’s collection status, see Viewing Indicator Collection Compliance.For information about setting up cascading indicators, see Cascading Indicator Readings to Other Assets.Note: The Publish Indicator Readings functionality is generally available. You must first enable feature 92 to use the functionality in APM. In the Enterprise window, select the Features view and the Enabled Features tab. Click Browse, select “Publish indicator readings to an external system” and click OK. If APM is running as a smart client, click Refresh Enabled Features on the server. Then restart the client to use the functionality.Initial Values
Daily Average
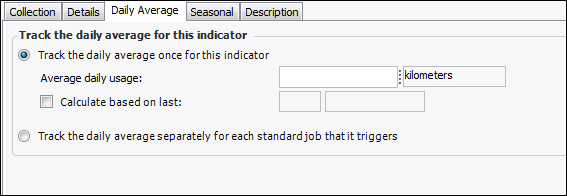
‘You can add a daily average calculation to any cumulative indicator. APM uses the daily average to evaluate the early warning clauses in standard job triggering rules and to predict when the next standard job will be triggered. In the calculation, APM only counts days that the asset had an “operational” asset status.Steps for Creating a Cumulative Indicator
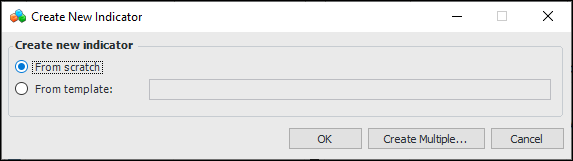
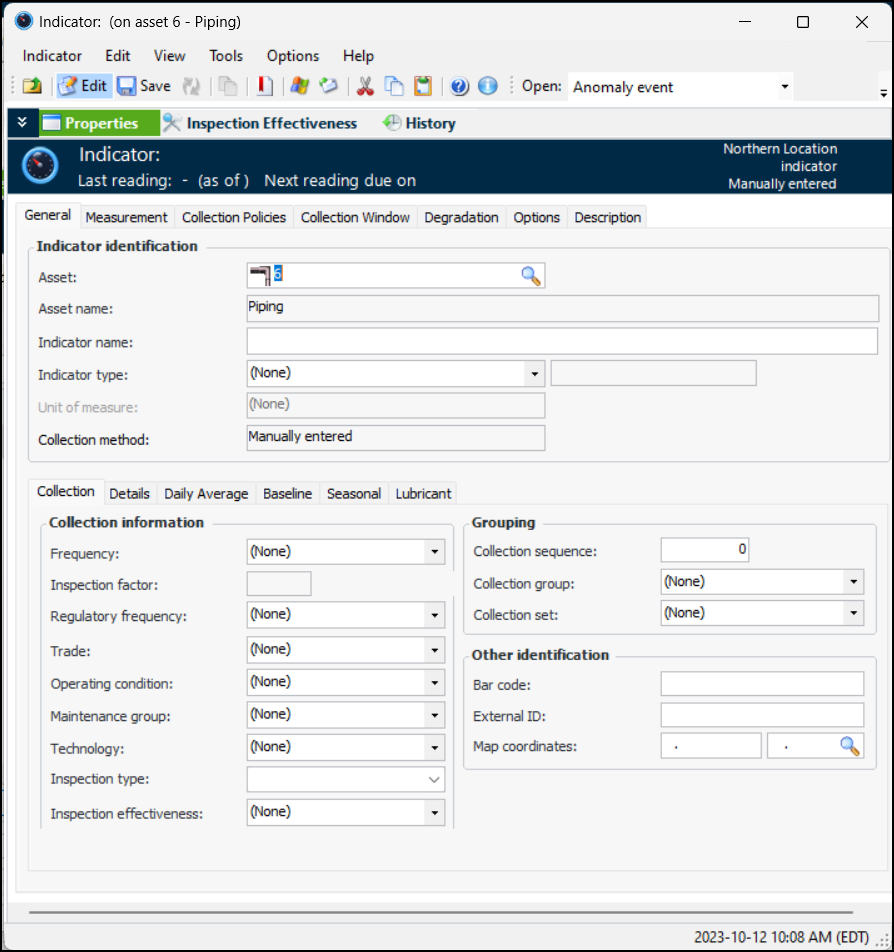
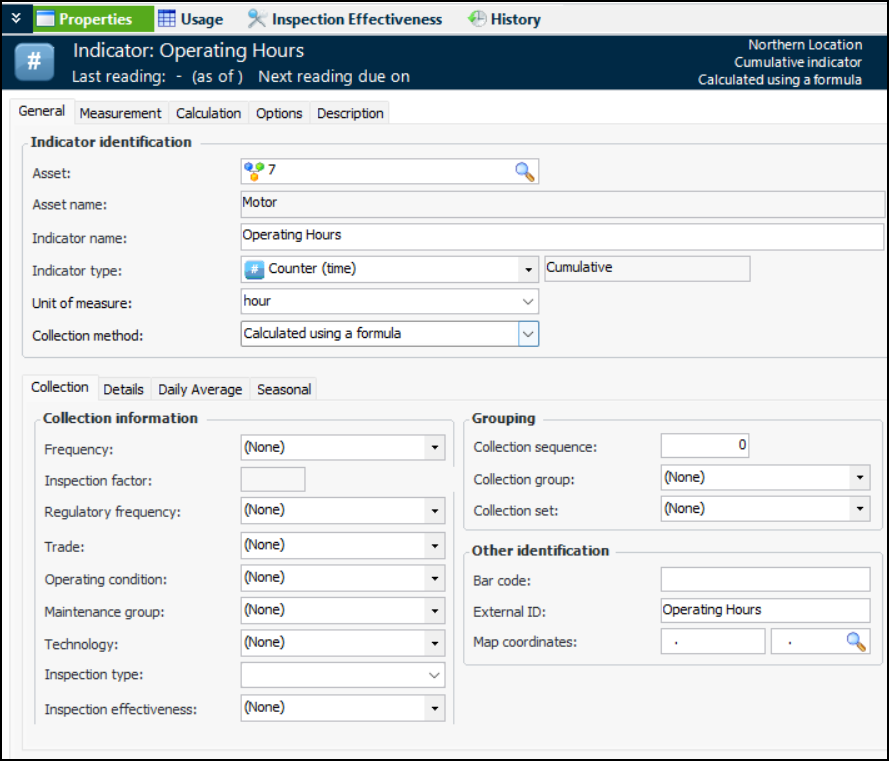
To Create the Indicator Record
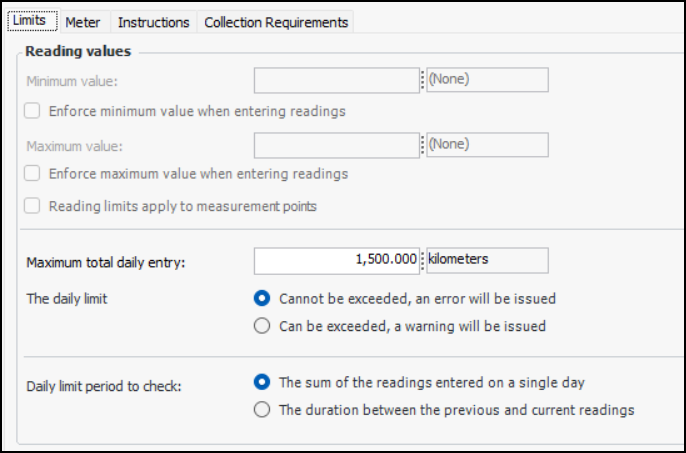
To Enter Collection Values
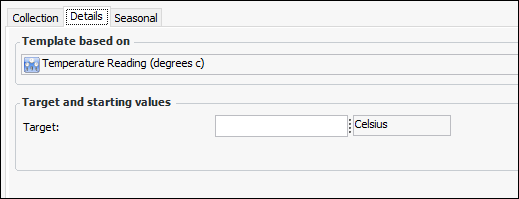
To Enter a Target Value
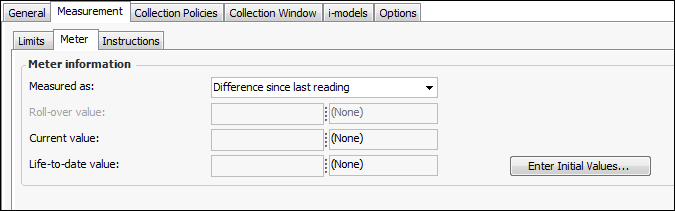
To Set Meter Values
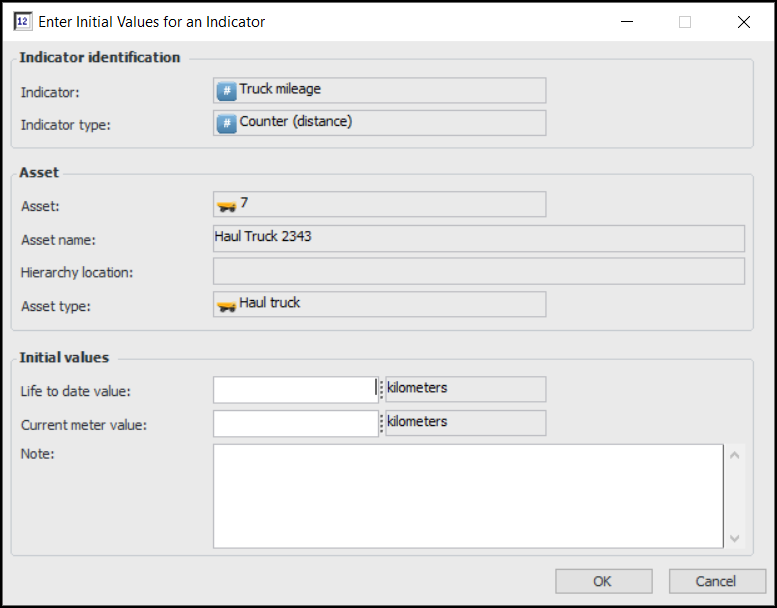
To Enter Initial Values
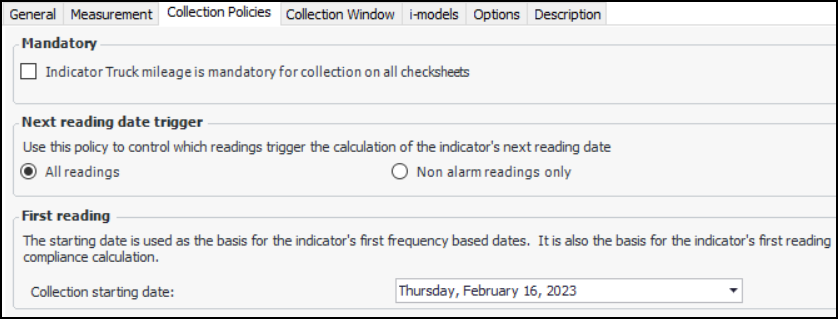
To Set Collection Policies for the Indicator
To Track the Daily Average for the Indicator
To Set Work Order Inclusion and Indicator Snapshot Options
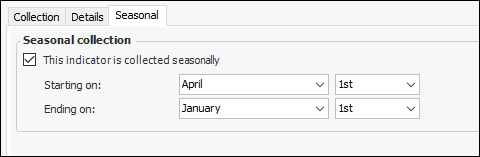
To Set Seasonal Options
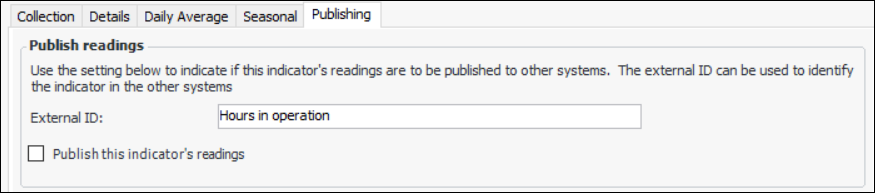
To Enable Publishing