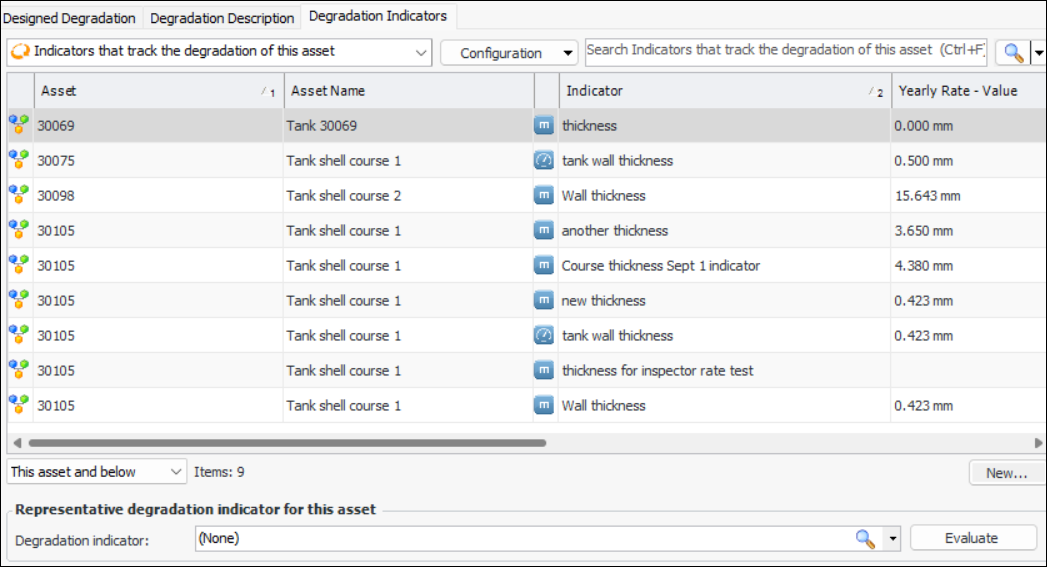
Adding Degradation Information to an Asset

When setting up an asset, you can record information about its designed degradation allowance and degradation rate (that is, the rate at which the asset is designed to degrade). You can also add indicators to track the asset’s degradation.
If the asset’s parent tracks degradation information, the child asset inherits the parent’s rates, and so on. You can view the parent’s information and choose to track degradation for the child asset separately.
Note: In order for the Degradation Info tab to appear in the Asset window, the asset type must allow degradation tracking.
This topic provides information about minimum value calculations and lining degradation, as well as instructions for adding degradation information to an asset:

Minimum Value Calculations

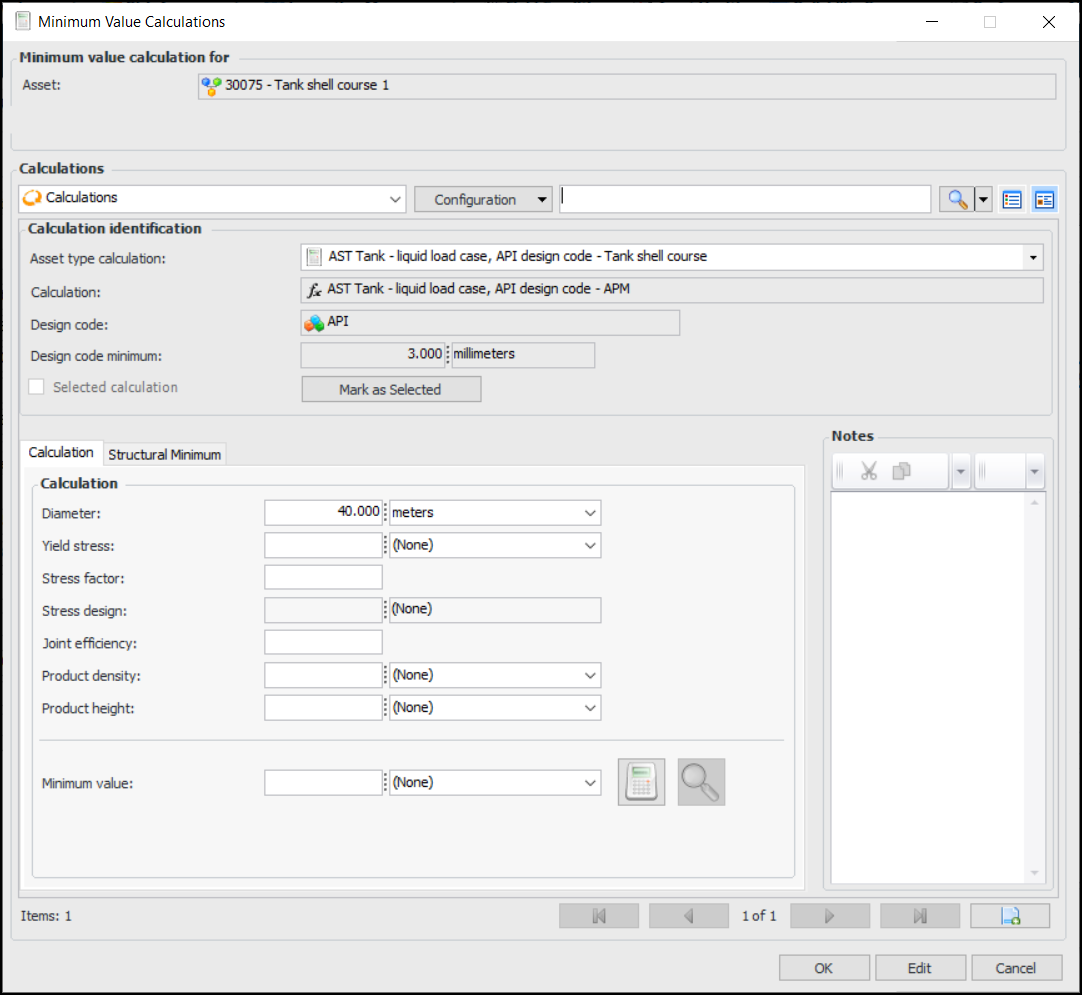
If the Minimum Value Calculator is supported by the asset type, you can have APM calculate the asset’s minimum degradation value using the formula appropriate to the asset type and design code (for example, API or BSI). Using the Minimum Value Calculations dialog, you can enter the asset’s dimensions and specifications and then click Calculate to arrive at a minimum value. You can try other formulas and inputs and then select the appropriate result to assign to the asset’s degradation information.
Tip: The formulas that are used to create calculations are provided by industry standards organizations, such as API (American Petroleum Industry), BS (British Standards), and ASME (American Society of Mechanical Engineers). For example, APM provides two versions of the liquid load case calculation for atmospheric storage tanks (API and BS design codes). For information about setting up calculations for your organization, see Creating a Degradation Minimum Value Calculation.

Structural Minimum Thickness for Pipe

If supported by the asset type, the calculated minimum wall thickness for pipe is evaluated against a structural minimum thickness lookup table. The most conservative value is taken; that is, APM applies the greater of the calculated or structural minimum thickness values as the asset minimum wall thickness.
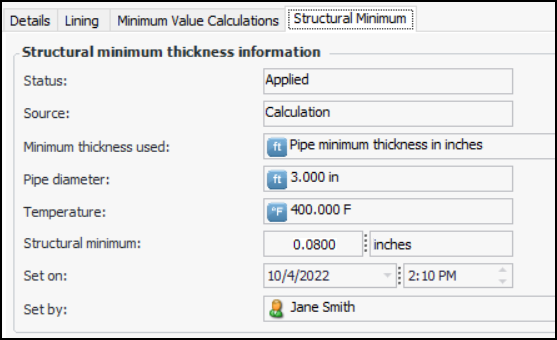
The Structural Minimum tab appears in the Asset window, Properties view, Degradation Info tab. After calculating the minimum value, select the Structural Minimum tab to see whether the structural minimum value was applied. For example:
Other possible statuses are Not applicable, Not applied, No applicable structural minimum thickness, and No minimum value found.
For more information, see Setting up Structural Minimum Thickness Lookup Tables.

Lining Degradation

If the asset’s properties support lining or coating, you can set up degradation information for it. After you have set the initial values, the lining’s remaining life is tracked using the life adjustment factor, which is a portion of the lining’s by-design life span, for example, one tenth of its original estimated life. The factor is used to estimate the lining’s remaining life based on its condition at the time of inspection.
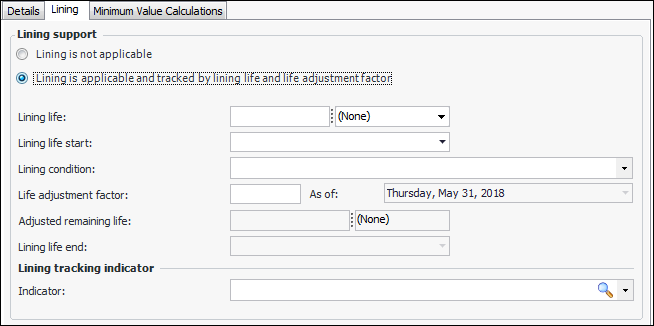
The life adjustment factor can be set manually, or it can be determined using strategy development analysis. See To Evaluate Confidence Factors in “Performing Risk Analysis for RBI Failure Modes”.
Lining delays the date when the asset’s degradation starts. The calculation used to determine the asset’s end of life uses the lining’s end date in place of the asset’s degradation start date. That is, asset degradation begins when the lining no longer protects it.
The Degradation Charts dialog shows the impact of lining life on the asset’s degradation rate. For example:
The calculation used to determine the indicator’s next inspection date uses the lining’s end date if it is earlier than the collection frequency and the regulatory frequency.
Note: When the lining information is updated, for example by an indicator reading, all of the asset’s degradation rates are also updated: short-term, long-term, asset design, indicator design, inspector, and up to three custom rates.

To Add Degradation Information to an Asset

1.
Open the asset. On the Properties view, select the Degradation Info tab.
If the asset’s parent in the hierarchy tracks degradation, its information is shown on a tab labeled with its number, as shown in this example for Asset 30069. (If the asset’s parent does not track degradation, APM takes the information from the grand or great-grand parent, if available.)
2.
To record degradation information for the current asset, select Track degradation design information for this asset. The This Asset tab is added to the window and shows the information for the parent asset. For example:
Note: Once degradation information is saved with an asset, you can no longer edit it by checking out the asset. Instead, the Change Design Info button is available in the Designed degradation allowance area. After you change values, the asset’s indicators are updated and their readings’ degradation rates are recalculated.
3.
On the This Asset tab, provide information about the designed degradation allowance:
Note: If the asset type supports the Minimum Value Calculator, you can click Calculate to arrive at the minimum value. For more information, see To Calculate the Minimum Degradation Value.
4.
On the This Asset tab, Details tab, the following information is displayed:
Tip: Click Chart to display the Degradation Charts dialog and view the degradation information in chart form. As indicator readings are taken to track degradation, the inspections are added to the graph.
5.
6.
Select the Degradation Description tab to add detailed notes about the asset’s degradation.
7.
Select the Degradation Indicators tab to browse for an existing degradation indicator or to create one.
When you create an indicator from this tab, its Track degradation using this indicator option is automatically selected.
For information about creating these indicators, see Creating a Degradation Indicator.
8.
Select an indicator from the Representative degradation indicator for this asset list. The representative indicator is used to show current degradation values for the asset. For example, when a failure mode is created for the asset, the degradation rates are copied from the representative indicator. Do one of the following:
If the asset type’s settings allow APM to automatically update the representative degradation indicator, click Evaluate to select the indicator. APM selects the indicator based on either current rates or design rates, as specified by the asset type setting

To Calculate the Minimum Degradation Value

1.
Click Calculate next to the Minimum value box. The Minimum Value Calculations dialog appears.
2.
Click to add a calculation. If available, select a calculation from the Asset type calculation list. The calculation values are added to the dialog. For example:
3.
The Calculation identification area shows the calculation and asset type, design code, and design code minimum from the asset type. You can select another asset type calculation from the list, if appropriate.
Note: If the calculation result is less than the value shown in Design code minimum, the design code minimum is used instead of the calculation result.
4.
The Calculation area displays the panel assigned to the calculation, which differs depending on the calculation’s design. Enter the values and units of measure to be used to calculate the minimum. Any existing values are supplied by the asset’s or its parent’s subtype or specification properties.
If you are using one of the calculations provided with APM for atmospheric storage tanks, use the following units of measure:
If you are working with a pipe asset, the asset type might support a structural minimum thickness lookup table. After calculating the minimum value, select the Structural Minimum tab to see whether the structural minimum value was applied. For example:
Other possible statuses are Not applicable, Not applied, No applicable structural minimum thickness, and No minimum value found.
5.
6.
Tip: To see the results in more detail, click the View Results icon . The Calculation Results dialog shows you the value calculated and data availability. Select the Results by Variable tab to view the calculation expression and the result values for each variable.
7.
Tip: You can view the different calculation pages using the navigation buttons:
8.
When you have decided on the minimum value to use, click Mark as Selected. The Selected calculation option is selected.
9.
Click OK to close the dialog. The Minimum value box shows the result of the calculation.
Tip: You can view, edit, and add calculations using the Minimum Value Calculations tab.

To Add Lining Degradation Information

1.
On the This Asset tab, select the Lining tab.
2.
Click Lining is applicable and tracked by lining life and life adjustment factor. For example:
3.
Note: The lining tracking indicator is typically a descriptive indicator on the asset with lining properties. Readings for this indicator do not automatically update the lining degradation information.