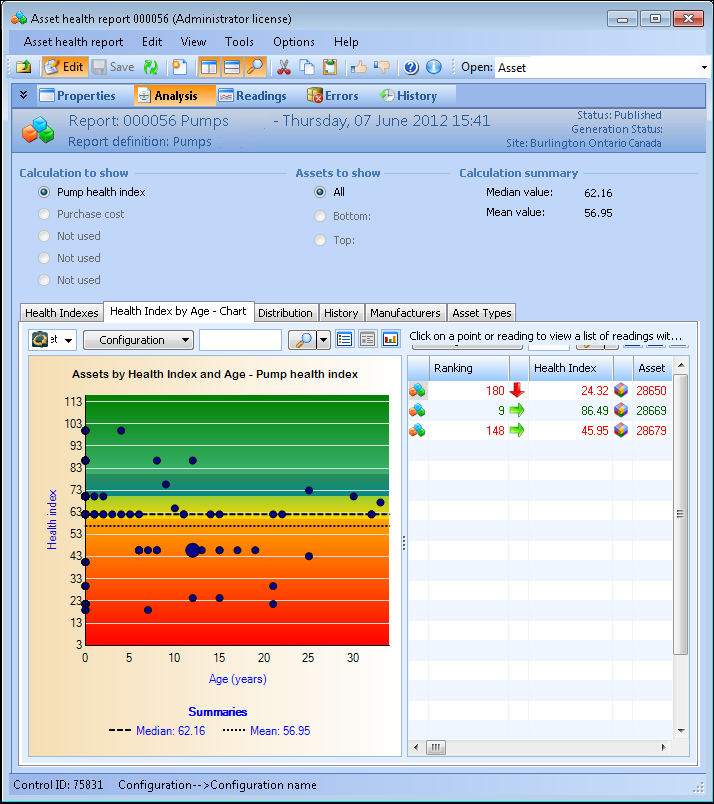
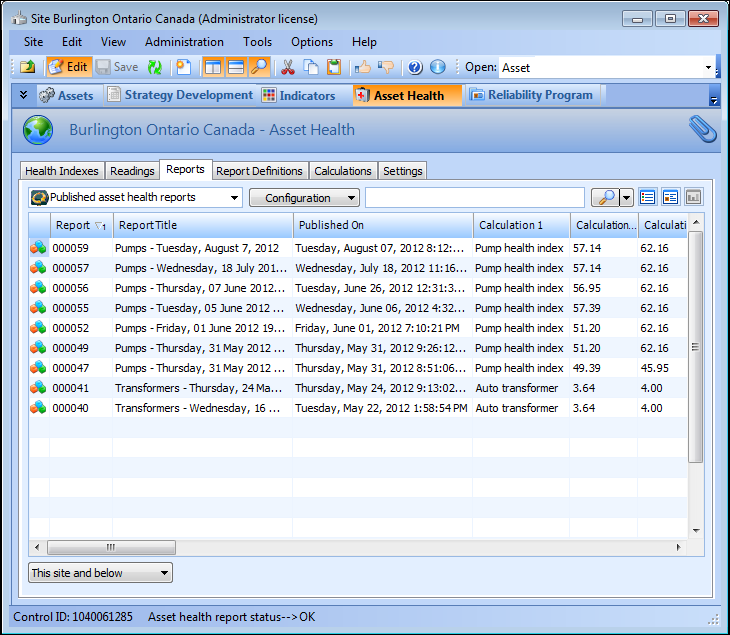
Viewing an Asset Health Report Analysis

An asset health report displays the results of the asset health calculations presented in the form of an online document. These reports can be generated either manually or automatically based on a recurrence pattern.
Asset health reports display detailed and graphical information from the results of calculations defined in asset health report definitions. These reports can be generated manually or automatically based on a recurrence pattern.
When an asset health report is generated, asset health readings are created for each of the assets included in the report. These readings can be viewed either via the asset health report itself, or directly on each asset. Each reading shows the overall value that was calculated for the asset in addition to the value that was derived for each of the inputs used in the calculation. These values are referred to as asset health indexes.
You can customize the way you want to display asset health reports by defining variable chart appearances. For more information, see Defining Variable Graph Appearances for a Chart”.
This topic describes how to view an asset health report analysis.

To View an Asset Health Report Analysis

1.
On the site, select the Asset Health view, and then the Reports tab. By default, all published reports for this site and below appear in the table.
2.
3.
4.
Double-click to open asset health report in the list and view its details. The Asset Health Report window appears, open to the Analysis view. On this tab you can select the calculation and assets to show in the analysis.
5.
In the Calculation to show area, select the calculation from the report definition that you want to analyze.
6.
In the Assets to show area, select the following:
All: All assets will be listed in the analysis.
Bottom: Select this option and then enter a number to filter the list to display only that bottom number of assets in the analysis. All other assets are excluded from the analysis.
Top: Select this option and then enter a number to filter the list to display only that top number of assets in the analysis. All other assets are excluded from the analysis.
7.
Based on the selections in steps 5 and 6, the median and mean values in the Calculation Summary area are determined automatically.
8.
Select the Health Indexes tab to view the list of assets by health index and age.
9.
Select the Health Index by Age - Chart tab to view assets by health index and age in a scatter graph format. For example:
Tip: You can click any point or reading in the chart and those readings with the same index value are listed in the table to the right of the chart.
10.
Select the Distribution tab to view a health index distribution for the report.
11.
Select the History tab to view a list of asset health assets that have been used in the report.
Tip: You can select an asset from the list on the left side, and its readings history is displayed in a chart on the right side.
12.
Select the Manufacturers tab to view a summary list of assets grouped by manufacturer and model.
Tip: You can select alternate configurations from the configuration list, such as the summary list based on asset manufacturer information.
13.
Select the Asset Types tab to view a list of assets grouped by asset type.
Tip: Click the plus sign beside the asset type name to expand the list of readings for that asset type.
14.