Introduction to 4D Indicators for Large Data Sets

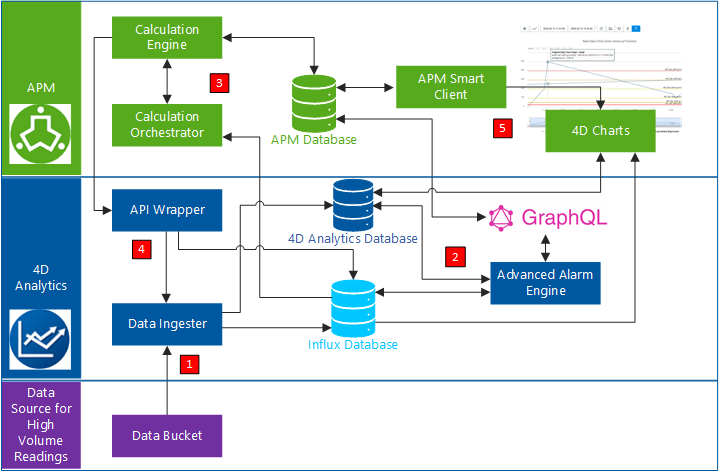
APM incorporates functionality from AssetWise 4D Analytics to process large datasets, like the readings that come from Industrial Internet of Things devices: interconnected sensors, instruments, and other devices throughout the plant. 4D Analytics makes it possible to ingest and process large volumes of indicator readings in a small amount of time. The readings are stored in a time series database (InfluxDB®) to preserve the sequential properties of the readings, for example, from oldest to newest reading based on their “Collected On” dates and times.
The partnership speeds up the processing of readings by reducing the volume of data that is pushed into APM. That is, only readings that cross alarm state boundaries are sent to the APM database. At the same time, the 4D Analytics Analytical Viewer provides a view into the Influx data from the APM Indicator window.
The APM Calculation engine reviews calculated indicators and, based on new input values, determines which need to be recalculated. The readings and calculation results are displayed in 4D charts and comparative analyses in APM for your review.
This topic looks at the related components, 4D calculated indicators, and how they differ from other APM calculated indicators.

Overview of the Components

APM incorporation with AssetWise 4D Analytics and third-party components InfluxDB time series database and GraphQL queries to push alarm readings to APM. Communication between the components relies on web services and REST calls. Authentication is handled using OpenID Connect (OIDC).
The architecture supports cloud-based deployment. The AssetWise components and InfluxDB can be hosted in the cloud and managed by Bentley, connecting to the user’s smart client instances. On-premise implementations of APM also support 4D indicators.
The following diagram shows how the components interact to process data:
1.
2.
If a reading value crosses into a different state from the previous reading, the GraphQL engine pushes the reading into the APM database. The readings are then available in APM, triggering alarms and warnings as appropriate.
New APM readings are also stored in the Influx database.
3.
The calculation engine performs the calculations, creating calculation groups as needed to control concurrent and sequential execution of calculations, ensuring that calculations are processed in the correct time series for each indicator.
Note: The calculation engine can be run from the command line (for testing purposes) or at regular intervals using a scheduled action.
One day is the recommended interval between calculation engine firings to prevent conflicts with ingestion and initial processing.
4.
5.

Calculated Indicator Groups

The calculation engine creates calculation groups as needed to control concurrent and sequential execution of calculations, ensuring that calculations are processed in the correct time series for each indicator.
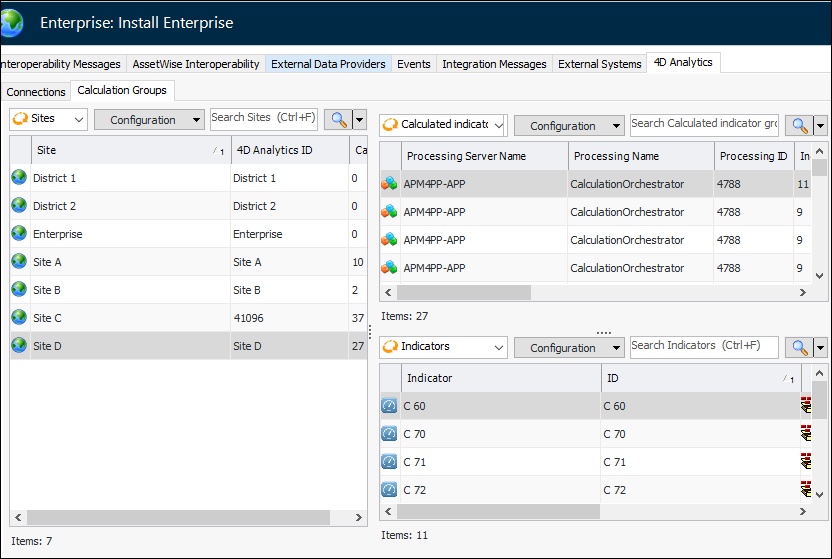
You can view calculation groups in the Enterprise window, Integrations view, 4D Analytics tab, Calculation Groups tab. Groups are listed by site, along with processing information and indicators. Select a group to view its calculated indicators in the table below. For example:

4D Indicators

To take advantage of the 4D Analytics functionality, set up your APM indicators to meet the following requirements. Each indicator must have:
For related information, see Setting up APM for 4D Indicators.
Note: To prepare data in existing APM databases for the implementation of 4D Analytics functionality, talk to your Bentley team about custom scripts that do things like turn on the 4D setting for calculated indicators.

View 4D Indicators in APM

APM provides table configurations specifically for 4D indicators.
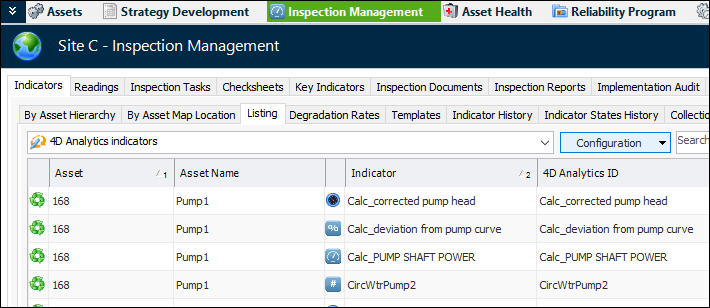
In the Site window, Inspection Management view, select the Indicators tab and the Listing tab. In the list of configurations, select “4D Analytics indicators”. The table lists the indicators by asset and includes the 4D Analytics IDs. For example:
In the Asset window, Inspection Management view, select the Indicators tab. Both the Listing and By Asset tabs provide 4D Analytics indicators configurations.
Select the Readings tab and then the By Indicator tab. Select a 4D indicator in the top table to view the 4D Analytics chart below:

View 4D Indicator Readings in the Analytical Viewer

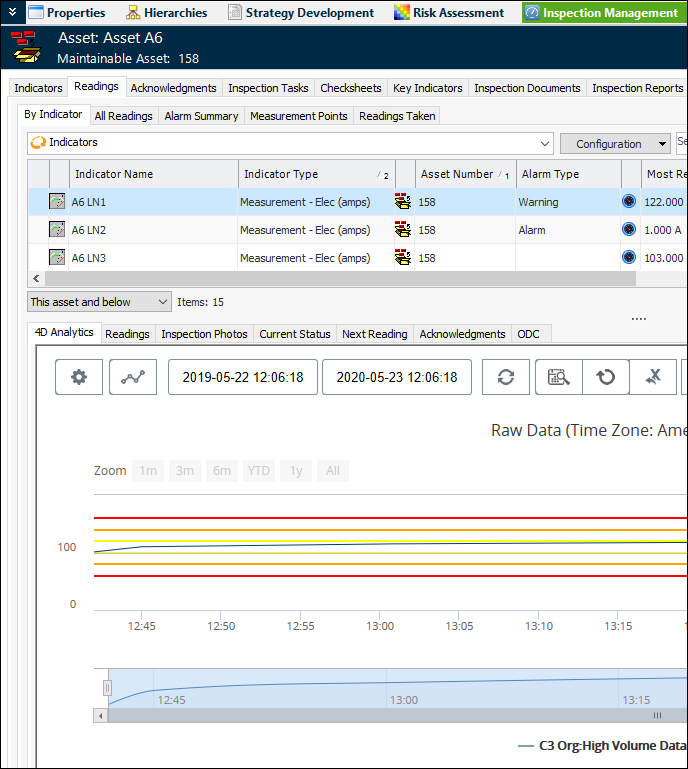
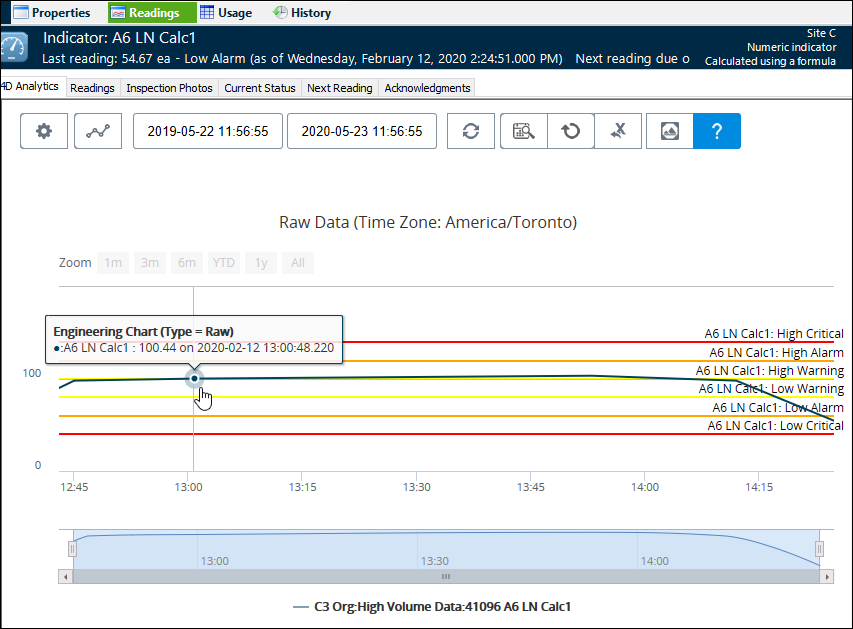
For a 4D indicator, open the Indicator window and select the Readings tab. The 4D Analytics tab displays the readings in the analytical viewer. For example:
The chart shows the indicator states in vertical bands. You can hover the mouse cursor over the reading line to view a reading’s value and time stamp. For information about using the analytical viewer tools, see Viewing 4D Indicators and Readings.

Test Calculations with “Live” Data

When developing 4D calculated indicators, you can test calculation inputs using indicator readings retrieved from the Influx database. You can also add readings to the Influx database for testing purposes. For more information about using Test (Live), see Creating 4D Calculated Indicators.

How 4D Calculation Indicators Differ from APM Indicators

As of release 7.12.4, 4D calculated indicators differ from other calculated indicators in APM in the following ways:

Indicator Frequency – Avoid Recurrence Patterns

When you are setting the triggering frequency for 4D calculated indicators, we recommend using either the default selection, “Whenever a new reading is entered for one of its inputs” or whenever a reading is entered for another input.
Indicator frequency based on a regular interval using a recurrence pattern has limitations:

Limitations of 4D Indicators

Influx values that have time stamps with three digits (including milliseconds) are not supported.